Finance professionals who vividly remember the 2008 economic crisis often associate liquidity risk with the Basel Accords, a series of banking regulations designed to ensure that financial institutions mitigate risk by maintaining adequate capital.
In this post, we’ll look at things from another angle, exploring the principles of measuring and managing liquidity risk in the context of non-financial institutions.
Before we consider that subject, however, it is important to first understand some of the possible sources of liquidity risk.
|
Table of Contents
What is Liquidity Risk?
Liquidity risk is the risk that a business will not have enough liquid assets to meet its short-term financial obligations as they come due. It occurs when there is a mismatch between the timing of cash inflows and outflows, leading to challenges in covering immediate needs such as payroll, supplier payments, or debt obligations. In extreme cases, liquidity risk can escalate into insolvency if the business cannot access the cash required to sustain operations.
This risk matters because cash flow is the foundation of a business’s financial health. Poor liquidity management can lead to operational disruptions, strained relationships with stakeholders, and a loss of financial flexibility. Furthermore, businesses facing liquidity constraints often incur higher financing costs, as they may be forced to seek expensive short-term loans or sell assets under unfavorable terms. Effective liquidity risk management is critical to maintaining stability and ensuring that financial resources are available to navigate both routine demands and unexpected challenges.
Sources of Liquidity Risk
To put it simply, liquidity risk is the risk that a business will not have sufficient cash to meet its financial commitments in a timely manner. Without proper cash flow management and sound liquidity risk management, a business will face a liquidity crisis and ultimately become insolvent.
As businesses go about the process of measuring and managing liquidity risk, they need to be on alert for common sources of that risk. Those sources include:
1. Lack of Cash Flow Management
Cash flow management gives a business good visibility into potential liquidity challenges and opportunities. Cash is king, and cash flow is the bloodline of all businesses. Without proper management of cash flow, a business will increase its exposure to unnecessary liquidity risks. Moreover, a business without healthy and well-managed cash flow will face an uphill battle to remain profitable, secure favorable financing terms, attract potential inventors and be viable in the long run.
2. Inability to Obtain Financing
A history of late debt repayment and/or non-compliance with loan covenant requirements may translate into additional challenges when attempting to secure financing. Therefore, it is imperative that businesses have good capital structure management, match debt maturity profiles to assets, and maintain a good relationship and regular communication with lenders. The inability to obtain funding at all or to obtain it at competitive rates and acceptable terms increases liquidity risk.
3. Unexpected Economic Disruption
At the start of 2020, the stock market was at an all-time high, and few people expected the world would be so hard hit by COVID-19. The adverse economic impact of this global pandemic was swift and relentless. Lockdowns created an unexpected economic disruption, and many businesses saw sales dwindle to a catastrophically low level and liquidity risk drastically increase.
4. Unplanned Capital Expenditures
Having proper fixed asset management is extremely important, particularly for a business that operates in a capital-intensive industry such as energy, telecommunications or transportation.
A capital-intensive business is often highly leveraged with a high fixed to variable costs ratio. For businesses like these, a single unplanned capital expenditure, such as a new purchase or major equipment repairs, may exacerbate existing budget constraints. This, in turn, further increases operating leverage and heightens liquidity risk.
5. Profit Crisis
A business in a profit crisis will not only see a decline in its profitability margins but also a decline in its top-line revenue. Consequently, to combat negative profitability margins and remain in operation, it will need to start dipping into cash reserves. Failure to stop a continuous cash burn will eventually deplete cash reserves, with the business inevitably facing a liquidity crisis. Developing a detailed cash flow forecast is a critical step in identifying potential shortfalls and creating a plan for recovery—learn more about cash flow forecasting here.
Measuring Liquidity Risk
One of the key elements of measuring and managing liquidity risk is the ability to identify the warning signs of a liquidity crisis. Beyond the identification of these signs, a business must also be able to measure risk magnitude so that it can take immediate and appropriate action to stop a downward spiral.
There are several ways of measuring liquidity risk, namely:
1. Analysis of Financial Ratios
Good liquidity management means performing financial ratios analysis, understanding what these ratios mean, and taking the necessary best course of action. Financial ratios provide a business with current indicators of liquidity risk based on its past performance, allowing it to make the required financial and operational tweaks to ensure it attains desired future financial and operational outcomes. The most common ratios are:
Quick Ratio
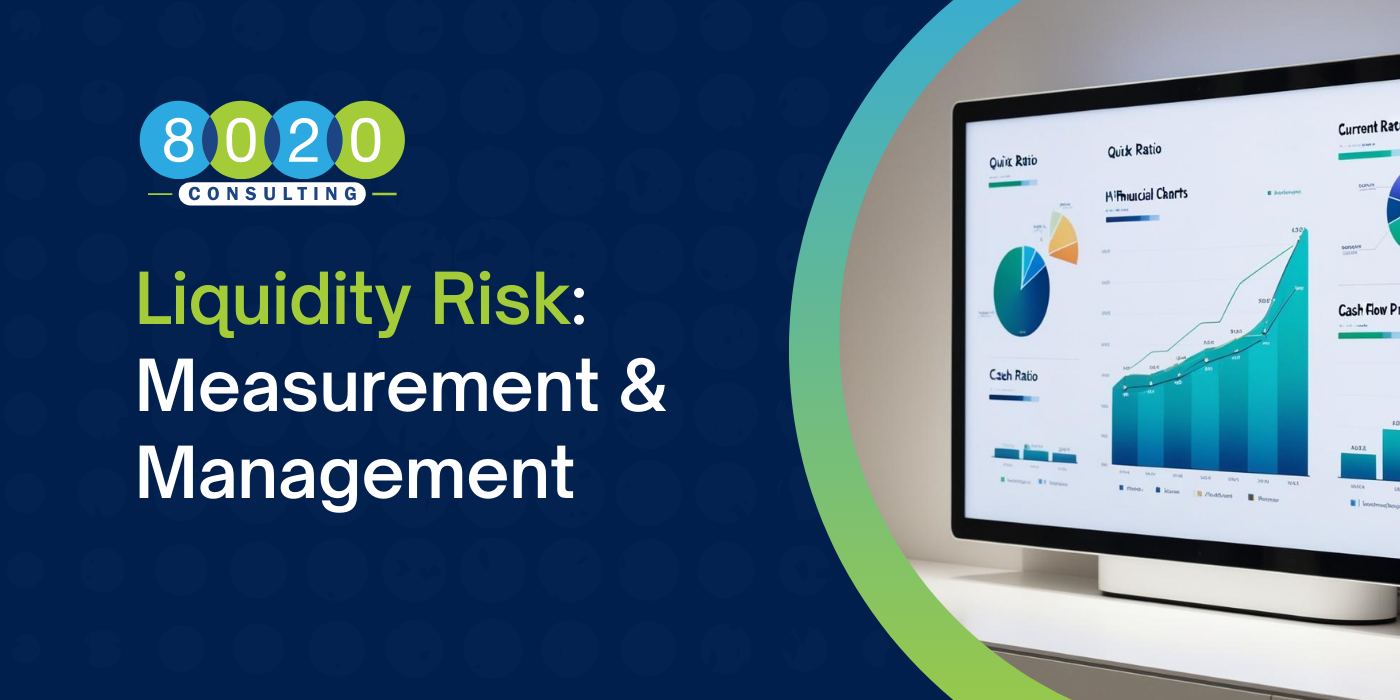
Quick ratio measures how well a business can meet its short-term financial obligations. Quick ratio is calculated by dividing the total cash, marketable securities and liquid receivables of a business by its total liquid current liabilities. A quick ratio of more than 1 means that the business is well-positioned to meet its short-term financial obligations. Less than 1, and the outlook goes the other way.
Quick Ratio Formula:
Formula:
Quick Ratio = (Cash + Marketable Securities + Accounts Receivable) / Current Liabilities
Example:
A business has $50,000 in cash, $20,000 in marketable securities, $30,000 in accounts receivable, and $80,000 in current liabilities.
Quick Ratio = (50,000 + 20,000 + 30,000) / 80,000 = 1.25
With a quick ratio of 1.25, the business is in a strong position to meet its short-term obligations.
Current Ratio
Just like quick ratio, current ratio measures the liquidity level of a business and its ability to use short-term assets to repay short-term obligations. Current ratio is calculated by dividing the current assets of a business by its current liabilities. A current ratio of over 1 is normally considered to be comfortable. A ratio below 1 may indicate a shortage of funds to meet short-term financial obligations.
Current Ratio Formula:
Formula:
Current Ratio = Current Assets / Current Liabilities
Example:
If a company has $150,000 in current assets and $100,000 in current liabilities:
Current Ratio = 150,000 / 100,000 = 1.5
A ratio of 1.5 indicates adequate liquidity to cover short-term liabilities.
Quick Ratio vs. Current Ratio
The key difference between the quick ratio and the current ratio lies in the treatment of current assets. The quick ratio excludes less liquid assets, such as inventory, and focuses only on assets that can be quickly converted into cash, such as cash, marketable securities, and accounts receivable. The current ratio, on the other hand, includes all current assets, making it a broader but potentially less conservative measure of liquidity.
The quick ratio is often preferred over the current ratio for assessing liquidity risk because not all current assets are equally liquid. For example, inventory may take significant time to sell, and accounts receivable could include balances past due by more than 180 days, with a higher chance that some will be uncollectible. By focusing on readily available assets, the quick ratio provides a more accurate snapshot of a business's ability to meet short-term financial obligations.
2. Cash Flow Forecasting
During any time of uncertainty, especially now, businesses should more than ever re-evaluate their operational strategy and profitability forecast. Importantly, management must have good visibility into potential liquidity difficulties and opportunities. That said, it is always prudent for a business to maintain and revise its cash flow forecast, crisis or no crisis.
Measuring and managing short-term liquidity risk is particularly critical for a business that has large transaction volume, such as a supermarket or restaurant. Longer-term cash flow forecasts can be used to support the strategic objectives of the business and provide financial details for lenders.
A cash flow analysis must be realistic and informational, allowing visibility and execution of management’s plans, justifying the merits of business strategies and aiding accountability.
3. Capital Structure Management
Debt is usually the cheapest source of financing given that debt has a lower cost of funding than equity and is also tax-deductible for a business. However, a business must manage and monitor its debt to equity ratio closely so that it will not become over-leveraged.
The more highly leveraged a business is, the greater its vulnerability to any downturn in cash flow. This vulnerability becomes even more serious if it coincides with times for debt repayment. A highly leveraged business has less capacity to absorb losses or obtain rollover funds.
To measure liquidity risk due to over-leverage, a business should look to see if it has enough liquidity to pay its debt interest and principle, and it should compare its gearing ratios to its competitors. The common leveraged (i.e., gearing) ratios are:
Debt-to-Equity Ratio
Debt-to-equity ratio measures the total liabilities of a business in relation to its shareholder equity. There is no optimal ratio. It really depends on the current health of the business as well as the industry that it is competing in.
For example, a high ratio might be desirable for a business that is experiencing high growth because leverage significantly increases its returns. However, if a business does not manage the amount of debt on its balance sheet, the high cost of borrowing will impede any benefits from leverage and increase the likelihood that the business will not be able to service its debt (i.e., liquidity risk).
Debt-to-Equity Ratio Formula:
Formula:
Debt-to-Equity Ratio = Total Liabilities / Shareholder Equity
Example:
A company with $500,000 in total liabilities and $200,000 in shareholder equity would calculate:
Debt-to-Equity Ratio = 500,000 / 200,000 = 2.5
This indicates that for every dollar of equity, the company has $2.50 in debt.
DuPont Analysis
Return on equity (ROE) is a profitability ratio that measures the rate of returns generated by invested equity (i.e., common stock). A higher ROE usually means that a business is more efficient in generating returns than its peers; a lower ROE means the opposite. DuPont analysis breaks down ROE into three components:
- Operating efficiency;
- Asset use efficiency; and
- Financial leverage.
These three components help a business better understand changes in its ROE over time.
As the profit margin increases, every sale will bring more cash flow and result in higher overall ROE. As asset turnover increases, a business will generate more sales per asset owned, also resulting in higher overall ROE.
Lastly, an increase in gearing should result in an increase in ROE because debt is usually the cheapest source of financing. The increased use of debt as financing will cause a business to have higher interest payments, which are tax-deductible. Because dividend payments are not tax-deductible, maintaining a high proportion of debt in a capital structure leads to a higher ROE.
By understanding the financial leverage component of DuPont analysis, a business can make an assessment to determine if increased liquidity risk, through the increase in leverage, can be offset by the benefits of a higher ROE.
DuPont ROE Formula:
Formula:
ROE = Profit Margin × Asset Turnover × Financial LeverageExample:
If a company’s profit margin is 10%, asset turnover is 2, and financial leverage is 3:
ROE = 0.10 × 2 × 3 = 0.60 or 60%This indicates a high return on equity due to efficient operations and strategic leverage.
Interest Coverage Ratio
Interest coverage ratio measures how easily a business can cover its interest expenses on outstanding debts. Interest coverage ratio is calculated by dividing earnings before interest and taxes (EBIT) by the total amount of interest expense on all outstanding debts. The higher the ratio, the lower the credit risk is to lenders. In turn, lenders will be more willing to support financing needs, thereby decreasing liquidity risk.
Interest Coverage Ratio Formula:
Formula:
Interest Coverage Ratio = EBIT / Interest ExpenseExample:
A business with $150,000 in EBIT and $30,000 in interest expense calculates:
Interest Coverage Ratio = 150,000 / 30,000 = 5An interest coverage ratio of 5 indicates sufficient earnings to cover interest expenses.
Managing Liquidity Risk
As we continue to look at the principles of measuring and managing liquidity risk, it’s time to turn to the management side of things. Liquidity risk can be mitigated through conscious financial planning and analysis and by forecasting cash flow regularly, monitoring and optimizing net working capital and managing existing credit facilities.
1. Forecasting Cash Flow
Many businesses, especially high growth ones with healthy balance sheets, diligently forecast their profit and loss but often neglect to forecast their cash flow because illiquidity has never been a concern.
However, it is imperative that all businesses regularly forecast cash flow in tandem with their other financial performance projections. A robust cash flow forecast will not only help businesses avoid having liquidity issues when they unexpectedly face higher than normal expenses but also reconcile the two key financial parameters of cash flow and profit.
No matter how large a profit a business makes, if it cannot convert that profit into cash, it will not be able to meet financial obligations such as covering payroll, paying for inventory, increasing liquidity, and avoiding insolvency risk.
Regular cash flow forecasting also forces businesses to better optimize net working capital to meet long-term financial goals.
2. Monitoring and Optimizing Net Working Capital
Financial professionals need to have an in-depth understanding of how business fluctuations affect financing and net working capital requirements. Improvements to working capital can be achieved through three statement projections and analysis of financial ratios such as:
Days Sales Outstanding (DSO)
DSO measures the average number of days a business takes to collect payment from a credit sale.
DSO is calculated based on average accounts receivable divided by total credit sales times 365 days. A low DSO implies that a business takes a shorter time to collect its payments from credit sales and vice versa.
There is no ideal DSO value because DSO varies hugely by industry. In addition, DSO trend is more important to analyze than the actual DSO value. For example, an increase in month-on-month DSO value may indicate a fall in accounts receivable collection efficiency or that some customers are taking more time to pay the business.
Days Sales Outstanding (DSO) Formula:
Formula:
DSO = (Accounts Receivable / Total Credit Sales) × 365Example:
With $30,000 in accounts receivable and $120,000 in annual credit sales:
DSO = (30,000 / 120,000) × 365 = 91.25 daysThe business takes approximately 91 days to collect payments from customers.
Days Payable Outstanding (DPO)
DPO measures the average number of days a business takes to pay its trade creditors.
DPO is calculated based on average accounts payable divided by cost of goods times 365 days. A low DPO implies that the business takes a shorter time to pay its trade creditors and vice versa.
Like DSO, DPO varies hugely by industry, and DPO trend is more important to analyze than actual DPO value. For example, if a business is trying to preserve its cash reserves to purchase new equipment, its month-on-month DPO value might rise because it is taking more time to pay its trade creditors.
Days Payable Outstanding (DPO) Formula:
Formula:
DPO = (Accounts Payable / Cost of Goods Sold) × 365Example:
If accounts payable is $25,000 and the cost of goods sold is $100,000:
DPO = (25,000 / 100,000) × 365 = 91.25 daysThe business takes an average of 91 days to pay its suppliers.
Days Inventory Outstanding (DIO)
DIO measures the average number of days a business takes to convert its inventory into sales.
DIO is calculated based on average accounts inventory divided by cost of goods times 365 days. A low DIO implies that a business takes a shorter time to convert its inventory into sales and vice versa.
Like DSO and DPO, DIO varies hugely by industry, and DIO trend is more important to analyze than actual DIO value. In general, a lower DIO indicates that the business has good inventory management and vice versa.
Days Inventory Outstanding (DIO) Formula:
Formula:
DIO = (Average Inventory / Cost of Goods Sold) × 365Example:
If a business has an average inventory of $50,000 and a COGS of $300,000:
DIO = (50,000 / 300,000) × 365 = 60.83 daysThis means the business takes approximately 61 days to sell its inventory on average.
Cash Conversion Cycle (CCC)
CCC measures the average number of days a business takes to convert its resources into cash flow. CCC is calculated based on the sum of DSO and DIO, less DPO.
CCC evaluates operations and management efficiency because it provides stakeholders with insights as to how long the business takes to realize cash flow from its investments in sales and production processes. A lower CCC value usually indicates that the business is efficient in managing its operations and vice versa.
Cash Conversion Cycle (CCC) Formula:
Formula:
CCC = DSO + DIO - DPOExample:
If a business has a Days Sales Outstanding (DSO) of 45 days, a Days Inventory Outstanding (DIO) of 60 days, and a Days Payable Outstanding (DPO) of 30 days:
CCC = 45 + 60 - 30 = 75 daysThe Cash Conversion Cycle of 75 days indicates the time it takes for the business to convert its investments in inventory and other resources into cash flows from sales.
3. Managing Existing Credit Facilities
The use of borrowed capital helps a business grow and be profitable because it gives it the ability to manage short-term and long-term needs such as bolstering its cash reserves for future net working capital requirements and capital expenditure investments.
A business must not only build a strong rapport with its lenders but also regularly monitor all of its existing credit facilities to ensure full covenants compliance, match facilities to the purpose of the loan, manage debt maturities and obtain the best financing rates.
Example:
If a business has a $1,000,000 revolving credit line with a 5% annual interest rate, it should regularly check its borrowing levels and ensure timely interest payments. By negotiating with its lender, the business could reduce the rate to 4%, saving $10,000 annually in interest expenses while maintaining liquidity for operational needs.
The Importance of Measuring and Managing Liquidity Risk
If business leaders don’t thoroughly understand liquidity risk sources and the principles of measuring and managing liquidity risk, insolvency risk skyrockets. Today’s unprecedented challenges have certainly underscored this.
Any business with liquidity concerns should consider bringing in an experienced, objective consultant for a thorough liquidity risk evaluation before trouble escalates. An expert can help to get you back on course and provide a plan for keeping you there.
Manage Your Company’s Liquidity Risk with Support from Experts at 8020 Consulting
If you need help measuring and managing liquidity risk, reach out to 8020 before a downward spiral has begun. You can also learn more about our cash flow forecasting services by downloading the resource below.


