The food and beverage industry is mammoth and a thriving part of the world economy. Globally, in 2021, the food and beverage manufacturing market totaled $5.8 trillion, $6.8 trillion in 2022 and is expected to reach around $7.2 trillion in 2023. The compound annual growth rate (CAGR) is 8.7%, which will result in expected growth of $8.9 trillion in 2026. With an industry this large, it’s important that strong financial planning and analysis are performed to properly account for growing sales, proper forecasting, financial reporting and necessary deep-dive analysis.
In this article, I will explain the important roles and responsibilities FP&A has as it relates to food and beverage manufacturing, including building the Annual Operating and Capital Plan, Production-Line Management, FP&A Stakeholder and Production Support, Production vs. Sales Units, Financial Reporting (KPIs) and Volume Variance Analysis. FP&A is unique in that there are not too many other functions within a company that partners so closely with every division within a company. As such, FP&A is regarded as an important member of the executive committee and takes part in high-ranking meetings and decision making.
Annual Operating Plan
Building an annual operating plan for a food and beverage manufacturing company requires a thorough understanding of the current market demand for your product, the target customers, the products to be produced, production quantity, production site, production process and distribution channels. The initial driver of any budget is sales, which comes from the sales team. At the beginning of the budget process, it’s acceptable to work with rough numbers, especially to get the wheels turning with the other divisions. With a sales plan in hand, we can estimate unit sales quantity, product sales, customer sales, and the quantity of products produced at different production sites. Additionally, we can plan COGS and several operational expenses since some are driven by sales numbers.
More specifically, in the food and beverage industry, SKUs (Stock Keeping Units) and bill of materials (BOM) are used to determine the level of sales units produced, in inventory and sold. SKUs serve as unique identifier codes to track inventory items and differentiate between products. Planning at the SKU level ensures the right inventory levels to meet customer demand while minimizing stockouts and overstocking. SKUs are also used for pricing the product in terms of COGS and sales. Each year, and sometimes twice a year for some companies, the SKU costs are updated to new standard costs through a process known as “setting new standard costs” or “rolling new standards.” This process requires in-depth analysis and is usually done outside of the annual planning process due to the time it takes.
The BOM is a comprehensive list of all the raw food and beverage materials required to manufacture a final product or SKU. It serves as a blueprint for the manufacturing process, providing detailed information about the materials needed at each stage of production. Knowing the unit sales will help determine the quantity of materials needed for each BOM and SKU, thereby determining the material COGS.
Once the quantity of each material is planned, the report is handed over to the Supply Chain team to begin costing the materials, which is called “sourcing.” The Supply Chain team contacts their standard vendors and perhaps new vendors to obtain the best pricing. The difference between the cost determined by the Supply Chain team and the Standard Cost is the Material Price Variance, which is recorded as an entry in the accounting books and charged against the current month’s operating expenses. Distribution planning is one of the final steps in the product’s life cycle. Establishing a distribution plan enables the logistics team to know which products are going to which customers, channels and locations.
Capital Plan
Capital expenditures are costly expenses for all companies but are necessary for business growth, especially when introducing new products that require different packaging or additional flavoring that necessitates machinery modifications. For example, during my time at Dreyer’s Ice Cream, we introduced a new slow-churn ice cream that required adding a new machine to the production line. Similarly, when we introduced different-sized Drumsticks, it required new parts in the production lines. Additionally, capital expenditures can include replacing outdated conveyor rollers, piping, freezers, labelers or any capital costs directly related to manufacturing. Non-manufacturing capital expenditures could involve facilities or IT-related expenses.
The typical capital expenditure process begins with a template created by the FP&A team, which is then distributed to all divisions, with most of the expected spending coming from the production plants. Division stakeholders complete the form and submit it back to FP&A, providing all the necessary information about the capex request, including cost, type (to determine depreciable years of service) and how the cost would justify the company’s growth. At this point, like most companies, the approval process goes through the executive committee to determine its justification.
Production Line Management
When initially building a production plan, it should include the Bill of Materials (BOM) for all the Stock Keeping Units (SKUs) and specify the plant where they will be produced. Planning at the plant level is crucial due to strategic factors such as regional distributors, labor costs, labor force, material costs, facility and utility expenses and management overhead. All these costs are included in the BOM rollup and associated SKUs based on their production location.
In the event of a production line failure at a plant that was intended to produce, let’s say, 237,000 units of a particular SKU, a prompt decision must be made to select an alternative plant with the necessary BOM inventory, regardless of any additional costs. Analyzing SKUs produced at a different plant than originally planned is also commonly known as “sourcing” in the food and beverage manufacturing industry, including at Dreyer’s.
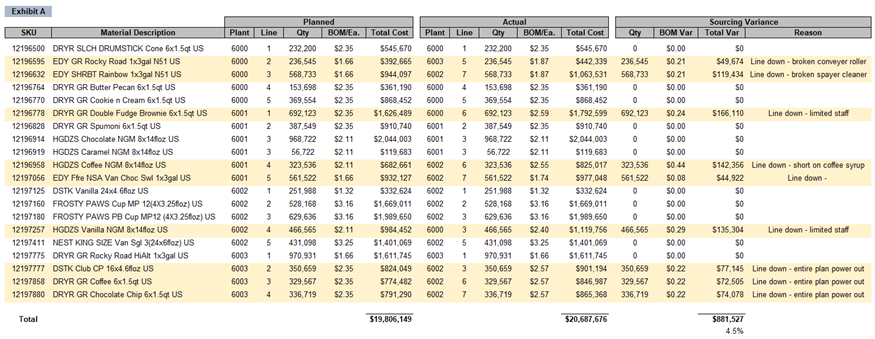
Exhibit A below presents an example of a sourcing variance analysis for 20 SKUs that were intended to be produced in one plant but were manufactured in a different plant due to various reasons. The total unfavorable variance in this example amounts to $881.5K or 4.5% for nine SKUs. Although these variance figures may appear concerning, the company will still achieve a satisfactory margin, eliminate employee idle time and maintain its commitment to delivering products on the shelf, thus retaining store and customer loyalty.
FP&A Stakeholder and Production Support
As mentioned previously, FP&A is one of the few departments that collaborates with every division within a company. This is primarily because planning, forecasting and analysis are required by every division, and FP&A serves as a partner in these endeavors. In food and beverage manufacturing, stakeholder support and understanding of production plants are crucial. Based on my experience with Fiji Water, Jamba Juice and Dreyer’s Grand Ice Cream, I’ve found that most of my support centered on the production areas. Having a solid understanding of forecasted sales enables you to determine the required inventory, staffing levels, plant production schedule, logistics schedule and vendor supply schedule. As units are produced in various plants, products are typically marked with a date stamp. This date stamp is significant because it allows easy reference to identify any production issues by correlating them with the specific date on the products. Furthermore, the date stamp proves helpful when conducting a cost of goods sold (COGS) analysis, comparing actual results to the planned figures. By examining the date stamp and the material costs associated with production on that particular day, you can ascertain the expected costs according to the plan and compare them with the actual results. Production vs. Sales Units
Food and beverage manufacturing makes a clear distinction between production units and sales units. Production units refer to the quantity of products manufactured in the factory, while sales units represent the total number of units sold. FP&A utilizes both production and sales volumes for cost accounting and sales analysis purposes. For instance, production units are measured during the manufacturing process to manage inventory levels, ensure adequate product availability to meet customer demand, calculate the cost of goods manufactured (including direct and indirect production costs), and evaluate manufacturing efficiency. On the other hand, sales units are measured after products are sold to customers and are used to determine customer demand, forecast future sales, calculate revenue generated from sales and assess the effectiveness of sales and marketing efforts. Both production units and sales units are crucial metrics for evaluating the performance of a food and beverage company.
Although they serve different purposes and provide insights into different aspects of the business, tracking both measures can inform future business decisions by shedding light on manufacturing efficiency and customer demand.
Financial Reporting and KPIs
Financial reporting in the food and beverage industry possesses unique characteristics that set it apart in several ways. One such characteristic is inventory valuation, which plays a crucial role in monitoring the freshness of food products and managing inventory levels. Another characteristic is the cost of goods sold (COGS), which encompasses not only the cost of raw materials and production but also expenses related to labor, packaging and transportation. Therefore, food and beverage companies must meticulously track and allocate these costs to ensure accurate financial reporting. Revenue recognition is another complex issue specific to the industry, especially for companies that distribute or sell products through intermediaries like distributors or retailers. In such cases, revenue may not be recognized until the products are sold by the distributor or retailer, leading to challenges in accurately reporting revenue. Additionally, many food and beverage companies experience business fluctuations due to seasonality. This was firsthand experience during my time at Dreyer’s, where sales soared during the warm summer months but slumped in the colder winter months. These fluctuations can significantly impact financial reports.
Key Performance Indicators (KPIs) are crucial metrics utilized to track and measure a company’s performance in relation to its goals and objectives. In the food and beverage industry, specific KPIs include Gross Profit Margin, Inventory Turnover, Labor Cost %, Cost Per Pound and Cost Per Pallet, among others. Tracking and analyzing these KPIs provides valuable insights into the business, enabling informed decision-making to improve operations and profitability.
Volume Variance Analysis
Fluctuating costs in the food and beverage industry, influenced by economic factors, weather conditions, logistics and more, pose challenges for planning. Understanding the causes of material variances becomes crucial in such circumstances, and this is where FP&A plays a vital role. FP&A is responsible for comprehending the ongoing activities in the production plant, including factors like downtime, waste, inventory shortages, labor shortages and logistics issues. When it comes to analyzing COGS variance, it is helpful to understand the drivers behind it. Breaking down the impact of volume, mix and price on COGS variance adds complexity but enhances analysis. This approach allows for a detailed examination of volume and pricing performances by product type in comparison to budgeted and actual values.
There are three primary components that contribute to COGS variance: volume, mix and rates.
- Volume variance occurs when more volume of one or more products is sold than planned, resulting in an overall cost impact.
- Mix variance arises when the distribution of products deviates from the planned volume. Analyzing mix variance involves assessing how the product is proportionately distributed within its total population. For instance, if we sold 100 cases of ice cream, and the total sales volume is 1,000 (10% of the total), while the plan called for 8% of ice cream sales, this 2% change in mix at the ice cream level creates an unfavorable cost variance, also known as mix variance.
- Rate fluctuations can occur unexpectedly and for various reasons. These changes may involve increases or decreases in vendor pricing for material purchases or changes in transportation and warehousing costs. Based on the bill of materials (BOM), these rate fluctuations can impact some or all products, directly affecting overall costs and creating a rate variance.
Typically, the impact of COGS variance is influenced by all three drivers: volume, mix and rate.
Learn More About FP&A in Food and Beverage Manufacturing
In summary, FP&A plays a crucial role in the food and beverage manufacturing industry. By providing essential financial insights and analysis, FP&A teams can assist companies in optimizing costs, managing supply chains, measuring performance and facilitating informed decision-making. Building strong relationships and collaborating closely with division stakeholders is vital for the success of FP&A teams. This partnership enhances the accuracy of financial forecasting, provides meaningful insights to decision-makers, and streamlines financial planning and analysis activities. FP&A bears the responsibility of producing reliable financial reporting on the state of the food and beverage industry, which demands careful attention to inventory valuation, COGS, revenue recognition, seasonality and other critical factors.
Visit our services area to learn more about how we work with clients to support their financial planning and analysis objectives.